| FX MARKET NEWS [4] |
| TECHNICAL ANALYSIS [4] |
| TRADING EDUCATION [4] |
| FOREX NEWS & ANALYSIS [7] |
01:18 EUR/USD Wave Structure Points Towards Higher Levels | |
Talking Points
-Possible triangle is ending above 1.1150
-Possible expanded flat the works higher, then eventually lower to 1.09-1.10
-Both scenarios offer a trading opportunity using 1.1150 as risk
Fears of a Grexit is growing as the politicians continue their hardline negotiations. On top of that, we have the FOMC rate decision releasing in the news in the next 24 hours. Perhaps Fed Chairwoman Janet Yellen can can some fuel to the EURUSD smoldering fire. Between these two events, there is plenty of event risk for the EURUSD over the next few days.
Let’s walk through a couple of higher probability possibilities using Elliott Wave analysis. For those unfamiliar with Elliott Wave Theory, it is a form of technical analysis that assesses the characteristics of the waves without regard to the corresponding news. We will highlight two possible scenarios below. These are not the only two scenarios, but what we believe to be the higher probability scenarios.
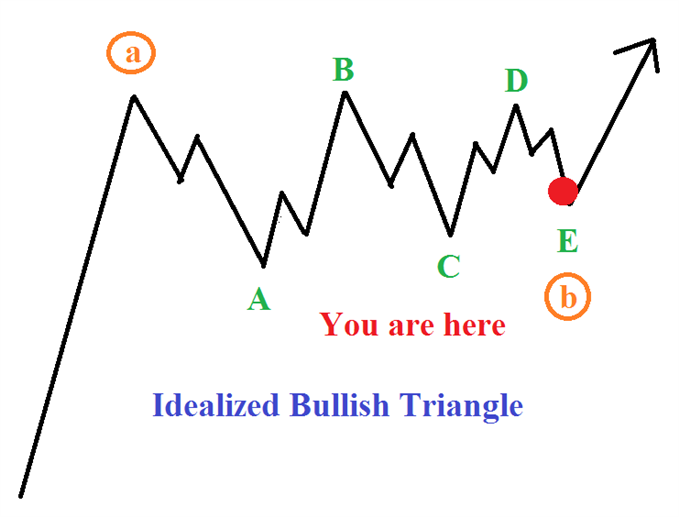
Bullish Triangle
The first scenario to unpack is that the EURUSD is placing the finishing touches on a triangle masterpiece. This means the triangle is the ‘B’ wave of an A-B-C upward movement. If this is correct, then a ‘C’ wave would be a breakout to higher levels that begins from nearby levels.
(Click on the chart below to zoom in; after zooming in, press the play button towards the right to set the market in motion) Created using TradingView Charts
The trading plan for the triangle view is quite simple. 1.1150 must hold under the current drawing and if correct, prices may reach 1.17. If 1.1150 breaks, then we’ll need to reassess if we are only in the red ‘c’ leg of the triangle, or if option #2 below is elevated.
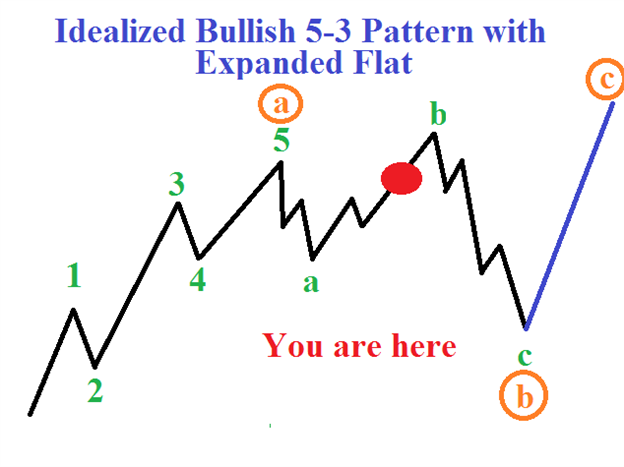
Expanded Flat
The second higher probability scenario we’re watching is a smaller degree expanded flat correction that eventually works down towards 1.09-1.10.
Though this is a downward correction, wave relationships suggest prices could falsely break above 1.1375, but would likely hold below 1.1500. In essence, 1.1375-1.1500 becomes a false breakout zone. Under this scenario, an ensuing sell off drops to 1.09-1.10, but holds above 1.0815. Against the backdrop of a medium term up trend, 1.09-1.10 becomes a higher probability long entry.
So under this scenario, we would see a false breakout higher, followed by a false breakout lower. The market, on many occasions, will confuse the most amount of people most of the time and this pattern helps that cause.
In the market shot above, this alternative is noted with “Alt:” labels in the chart. The image below shows an idealized pattern of the expanded flat and our current location.
Combining the Two Possibilities
One of the biggest challenges of the wave picture on the EURUSD is that until 1.1050 or 1.1500 is broken, the top two interpretations discussed above are still alive. Meaning, Elliott Wave uses deductive reasoning and that anything possible, though of low probability, is still possible. Once a wave count can be eliminated, then the picture cleans up.
However, with that being the case, we do have an interesting opportunity. For example, it is possible under both interpretations above that prices could move to 1.13-1.15 with interpretations remain valid. Therefore, with a fairly small risk on the trade, one could consider a long position and a stop loss just below 1.1150.
Keep in mind risks associated with trading through news and the FOMC decision on Wednesday if you choose to do so. First, liquidity thins out so spreads will widen. It is imperative that you have enough margin in the account to weather the widening of spreads.
Secondly, as a result of thin liquidity, prices may jump and gap. That opens the door to getting slipped on stop losses.
As a result, any trading through news should be handled with very conservative or no leverage on the trades.
Other wave counts:
EURUSD Finishes Wave X (Daily Chart)
How Much Juice is Left in USDJPY Bulls? (Daily Chart)
EUR/AUD Suggests EUR Out Performance (4 Hour Chart)
Most Retail Traders are Positioned for a Kiwi Bounce (2 Hour Chart)
Make sure to join me Monday mornings at 9:30a ET inside the DailyFX Plus Live Classroom for the US Opening Bell webinar [free registration]. In this webinar, we analyze the major FX pairs using Elliott Wave technical analysis.
-Written by Jeremy Wagner, Head Trading Instructor, DailyFX.su
Want to follow the Elliott Wave analysis on the EURUSD beyond the news event? You have the ability to copy my charts above so they appear on your desktop exactly as shown above. Email me at jwagner@dailyfx.com if you wish to receive instructions on how to do so. Feel free to comment on the chart with your views.
Follow me on Twitter at @JWagnerFXTrader . | |
|
| |
| Total comments: 0 | |