| FX MARKET NEWS [4] |
| TECHNICAL ANALYSIS [4] |
| TRADING EDUCATION [4] |
| FOREX NEWS & ANALYSIS [7] |
01:27 USDollar Trend Retracement | |
Talking Points
USDollar 30Minute Chart
(Created using Trading View Charts: Click on the chart below to zoom in; after zooming in, press the play button towards the right to set the market in motion)
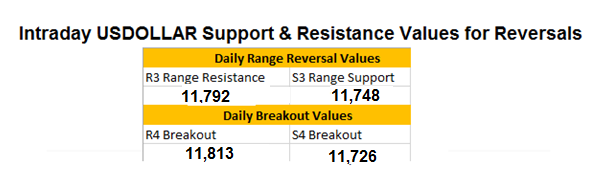
The USDollar has started today’s trading testing resistance and trading back inside of its trading range. Today’s range begins at the R3 Camarilla pivot point found at 11,792. If price continues to trade under resistance, this morning’s move could be taken as a retracement against the USDollar's primary trend. A continued decline from this point would open the Index to test values of support which include the S3 support pivot found at 11,748. A further price decline to the S4 pivot would have larger bearish implications for the USDollar, as the index potentially would close this week’s trading printing a fresh lower low.
Alternatively, in the event of a bullish reversal, breakout traders will focus on the R4 pivot at 11,813. A move beyond this point would be significant and considered a counter trend move. It should be noted that price has not closed above a daily R4 pivot in the last 8 trading sessions. In this scenario, trend traders should consider adjusting their trading accordingly going into the weekly close.
Using Camarilla pivots is just one way to approach day trading. To help you get started in your trading pursuit, DailyFX hosts a variety of day trading webinars. To learn more and register for future events, see the webinar calendar listed.
---Written by Walker England, Trading Instructor
To contact Walker, email wengland@fxcm.com.
Contact and Follow Walker on Twitter @WEnglandFX. | |
|
| |
| Total comments: 0 | |